Client Results Pressure is one of the heaviest burdens for Virtual Assistants.
You are delivering.
You are optimizing.
You are working diligently.
But internally, you carry this concern:
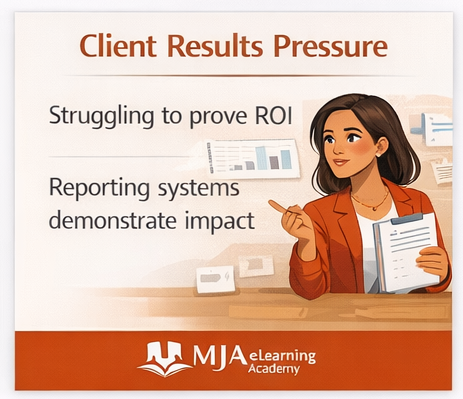
Struggling to prove ROI
When results are not clearly visible, anxiety increases.
Even when performance is improving.
🔎 What Struggling to prove ROI Really Means
Struggling to prove ROI often stems from:
• No standardized reporting
• No defined KPIs
• Inconsistent metric tracking
• Emotional interpretation of results
• Lack of visual data presentation
Clients cannot value what they cannot see.
Impact must be documented.
📉 The Stress Cycle
Without reporting systems:
• Clients question progress
• You over-explain verbally
• Meetings feel defensive
• Renewal conversations feel tense
Pressure builds because proof is unclear.
🔁 The Structural Reframe
Reporting systems demonstrate impact
When performance is measured, communicated, and contextualized, authority increases.
Reporting systems demonstrate impact because they convert effort into evidence.
🧠 Why Virtual Assistants Avoid Structured Reporting
Common reasons include:
• Fear of analytics
• Belief that clients “already know”
• Lack of dashboard tools
• Time constraints
• Uncertainty about which metrics matter
But clarity reduces pressure.
And pressure reduces confidence.
🧩 The ROI Visibility Framework
If Client Results Pressure is rooted in Struggling to prove ROI, here is the corrective structure.
Step 1 — Define Core KPIs
Choose 3 to 5 metrics per client.
Examples:
• Engagement rate
• Conversion percentage
• Email open rate
• Lead growth
• Revenue attribution
Reporting systems demonstrate impact when metrics are consistent.
Step 2 — Establish Reporting Frequency
Create:
• Monthly summary
• Quarterly review
• Performance comparison charts
Predictable cadence builds trust.
Step 3 — Contextualize the Data
Never send raw numbers alone.
Include:
• What changed
• Why it changed
• What will be adjusted
Data without interpretation lacks authority.
Step 4 — Visualize Results
Use:
• Dashboards
• Charts
• Before-and-after comparisons
Visual structure increases perceived professionalism.
📊 Example Transformation
Without Reporting:
Client: “Are things improving?”
With Reporting:
“Engagement increased 18 percent month-over-month. Conversion improved 6 percent after subject line optimization. Next month we will test segmentation.”
Confidence shifts instantly.
Reporting systems demonstrate impact because they reduce ambiguity.
🌿 Emotional Relief Through Structure
Client Results Pressure decreases when evidence increases.
You no longer rely on memory.
You rely on metrics.
Metrics protect confidence.
🚫 Mistakes That Increase Pressure
• Reporting inconsistently
• Tracking vanity metrics only
• Avoiding difficult data
• Failing to explain fluctuations
• Skipping documentation
Transparency builds trust.
👩🏽💼 Why This Belongs in AI Strategy
Inside AI Strategy, we teach:
• KPI selection
• Automated reporting tools
• AI-generated performance summaries
• Optimization frameworks
Reporting systems demonstrate impact because AI simplifies data interpretation and presentation.
Impact becomes visible.
And visible impact commands retention.
🔄 The Authority Reinforcement Loop
Measure
↓
Interpret
↓
Report
↓
Optimize
↓
Renew contracts
This loop transforms pressure into power.
📌 The Professional Stability Shift
When you eliminate Struggling to prove ROI, you eliminate defensiveness.
You gain:
• Confidence
• Clear communication
• Renewal leverage
• Pricing stability
Proof replaces pressure.
And proof strengthens authority.
If you recognize yourself in this pattern, you’re not alone. Most Virtual Assistants were never taught structural positioning.
Click the link to download the Strategic VA Shift™ Framework.
If you’re ready for deeper implementation support, schedule a 15-minute clarity session with MJA eLearning Academy.